Accumulation curve analysis
accumulation_test.RdThis function generates accumulation (rarefaction) curves for each sample in
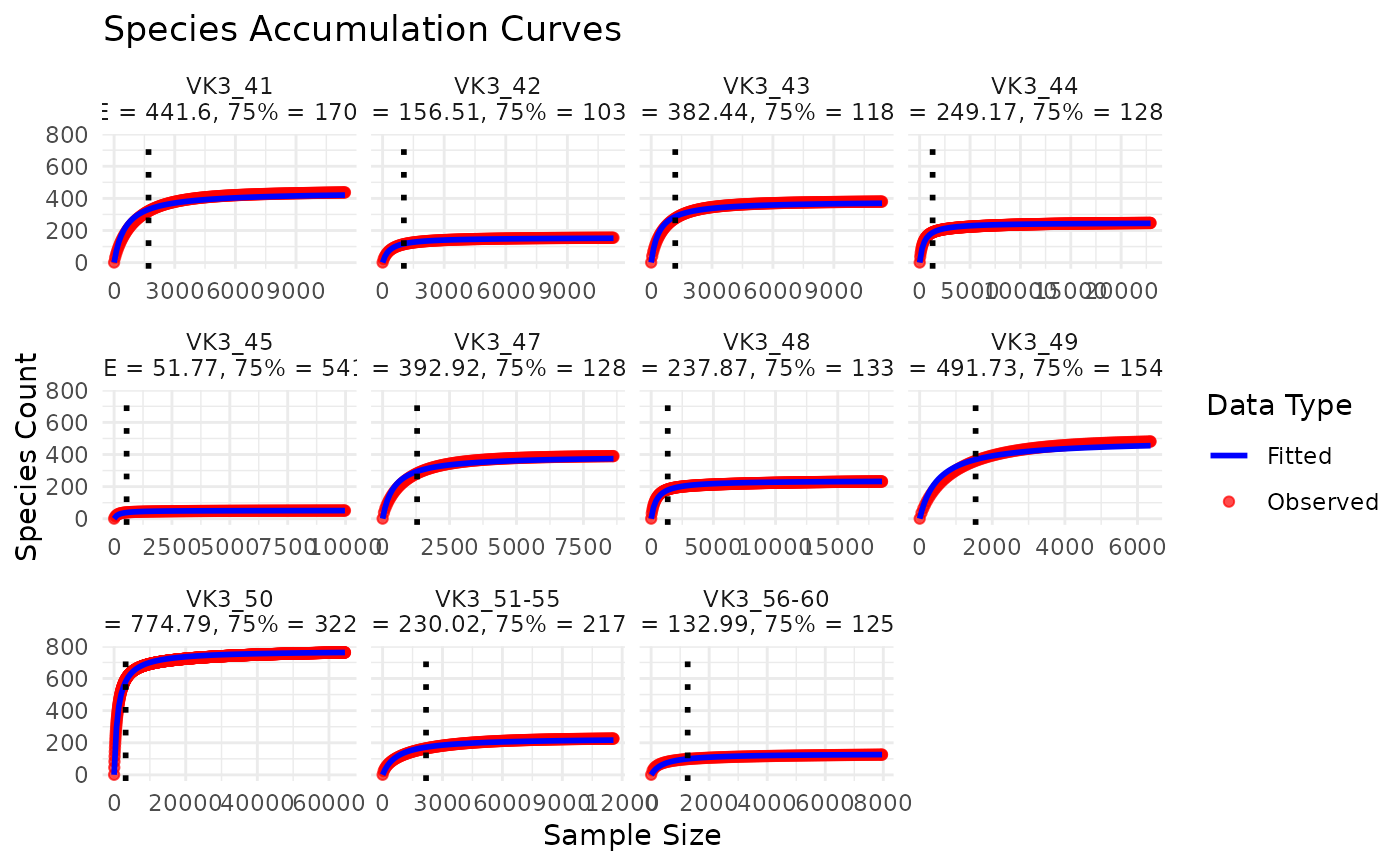
a given phyloseq object.
Value
A list containing:
accumulation_plot: Aggplotobject with all sites faceted.threshold_density: Aggplotdensity/histogram plot of the 75% ACE thresholds.individual_plots: A list ofggplotobjects, one per site.nls_failed_sites: A character vector of site names for which the nonlinear model failed to converge.quality_failed_sites: A character vector of site names for which the model converged but failed quality-control criteria (e.g. implausible threshold or poor fit).fitted_table: A data frame containing per-site model results and diagnostics, including fitted parameters, threshold estimates, and quality-control flags.
Details
It fits a general accumulation model using the Abundance Coverage Estimator (ACE) as an asymptote, and identifies the sequencing depth at which 75% of the ACE value is reached. It also produces a density plot showing the distribution of these 75% completion thresholds.
Sites that fail model fitting or quality-control criteria are excluded from downstream analyses, and their identities are returned for inspection.
Examples
library(Sibyl)
# Creating a smaller subset of the data
adults_sub <- phyloseq::subset_samples(adults, location=="VK3")
# Running accumulation tests on a phyloseq object, higher step size reduces
# execution time.
accumulation_test(adults_sub, step=50)