
Perform Dirichlet Monte Carlo ordination
dirichlet_ordination.RdThis function performs repeated Monte Carlo sampling from the Dirichlet
posterior distribution estimated by ALDEx2::aldex.clr() on a phyloseq
object, computes ordination using Aitchison distances, and generates a
PCoA-based visualization. It follows the same downstream pipeline as
repeated_rarefaction() (alignment by Procrustes rotation and consensus
coordinates), replacing repeated rarefaction with a probabilistic model
of compositional uncertainty. This enables a direct comparison of
uncertainty arising from stochastic subsampling versus probabilistic
compositional modeling, while preserving an identical downstream analysis
pipeline.
Usage
dirichlet_ordination(
  input,
  draws = 128,
  colorb = "sample_id",
  group = "sample_id",
  cloud = TRUE,
  ellipse = FALSE,
  cores = 2,
  ...
)
Arguments
- input
A
phyloseqobject.- draws
An integer. The number of Monte Carlo draws to sample from the Dirichlet posterior. If too few draws are selected it would not be possible to draw an ellipse around the group.
- colorb
A string. Column name in
sample_data(). Used to color sample points.- group
A string. Column name in
sample_data(). Used to group the samples, and to condition the Dirichlet sampling performed byALDEx2::aldex.clr(). The parameter is also used to draw an ellipse around the points.- cloud
A boolean. If
TRUE, all the data points generated from the Monte Carlo draws are shown. Otherwise, only the median points of each sample draw cloud are plotted.- ellipse
A boolean. If
TRUE, confidence ellipses around sample groups are drawn.- cores
An integer. Number of cores to use for parallel processing.
- ...
Additional arguments are reserved to internal use.
Value
A list containing (While also showing the plot directly):
draws: Number of Monte Carlo draws.df_consensus_coordinates: A data frame with coordinates of the median points of the sample clouds.df_all: A data frame of coordinates ordered by ordination number, along with metadata.plot: aggplotobject.
Examples
library(Sibyl)
# \donttest{
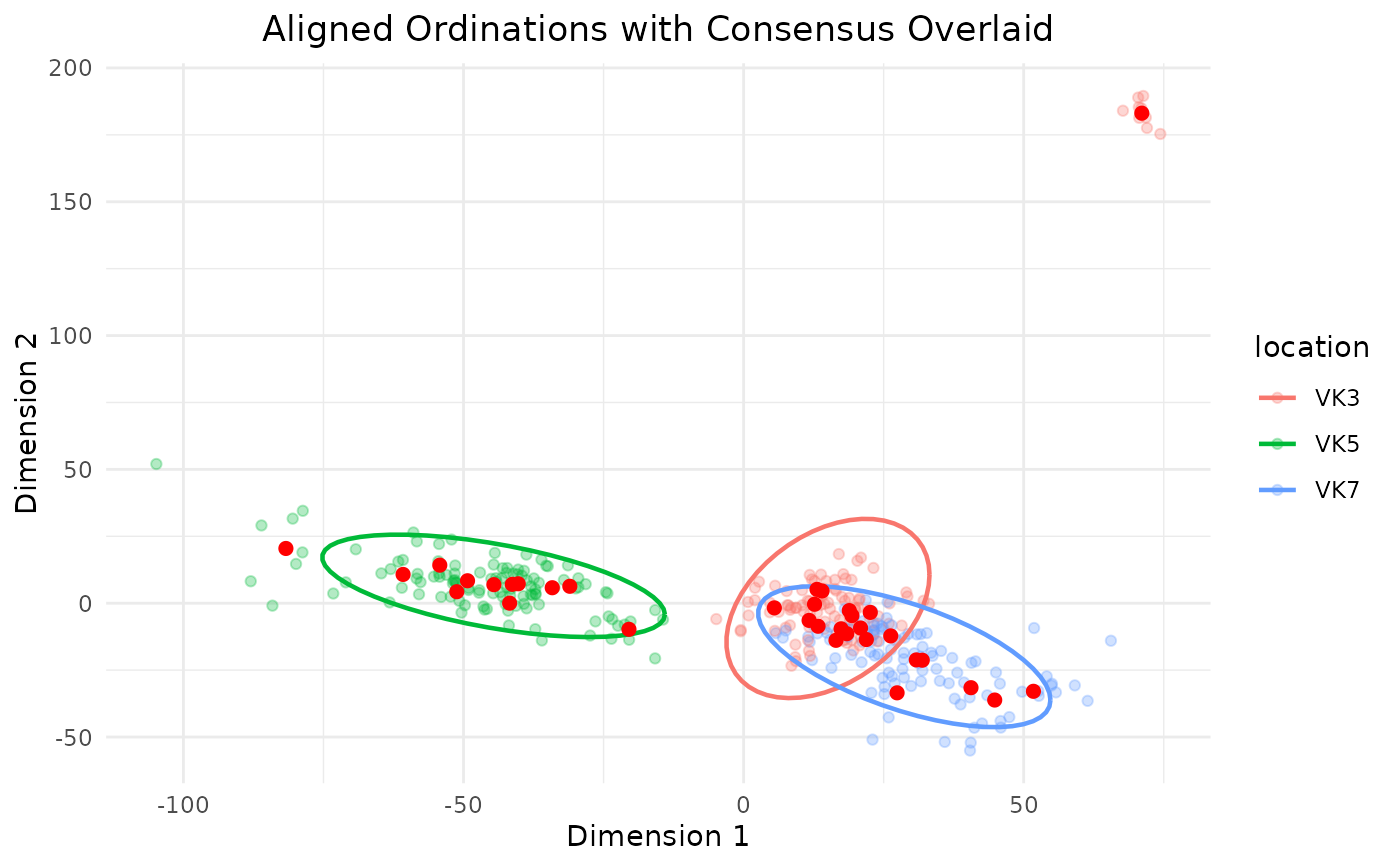
# Running this with cloud = TRUE and ellipse = TRUE will generate a plot
# where the samples belonging to the same group will be colored similarly
# and an ellipse will be drawn around the group.
dirichlet_ordination(adults,
draws = 10,
group = "location",
colorb = "location",
cloud = TRUE,
ellipse = TRUE)
#> conditions vector supplied
#> multicore environment is is OK -- using the BiocParallel package
#> Warning: values are unreliable when estimated with so few MC smps
#> computing center with all features
 # }
# }