Test different rarefaction thresholds
test_threshold.RdThis function uses the same steps of repeated_rarefaction in a repeated
fashion and summarizes the results across multiple thresholds.
Usage
test_threshold(
  input,
  repeats = 50,
  t_min = 50,
  t_max = 250,
  t_step = 5,
  group = "sample_id",
  cores = 2,
  verbose = TRUE,
  ...
)
Arguments
- input
A
phyloseqobject.- repeats
An integer, or a vector of integers. The number of times to repeat rarefaction. A value of 1 means no repeats. If a vector, different rarefaction thresholds will be tested sequentially.
- t_min
An integer. The minimum value for the threshold testing range.
- t_max
An integer. The maximum value for the threshold testing range.
- t_step
An integer. The step size for the threshold testing range. A value between 0 and 1 will cause the same threshold to be tested multiple times.
- group
A string. Column name in
sample_data(). Used to group the samples. The parameter is also used to draw an ellipse around the points. It the context of this function, is also the value that will be used for the calculation of the Calinski-Harabasz index.- cores
An integer. Number of cores to use for parallel processing.
- verbose
A logical. If
TRUE, prints messages during the execution.- ...
Additional arguments are reserved to internal use.
Value
A list containing:
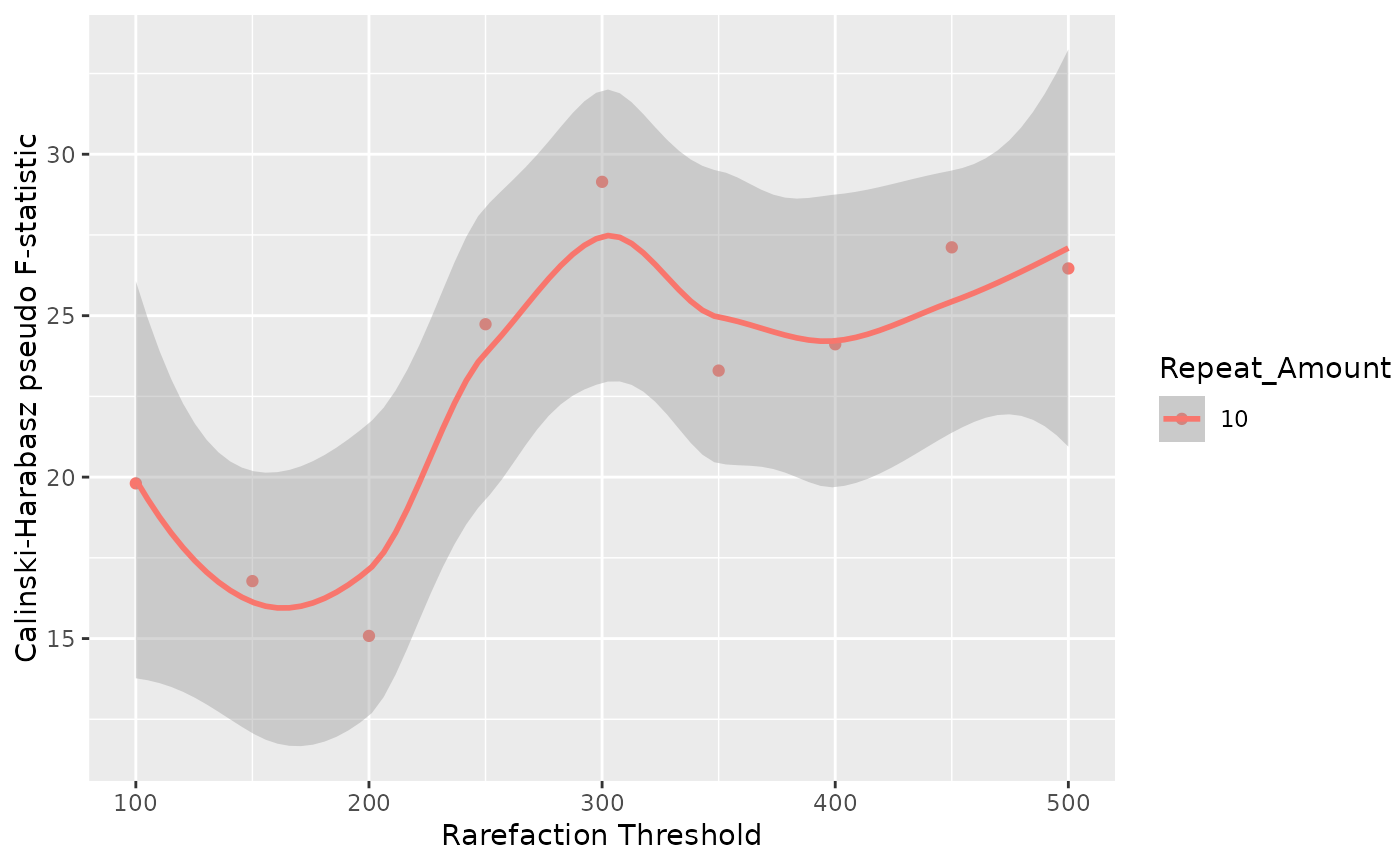
index_plot: Aggplotobject showing a scatterplot of Calinski-Harabasz index vs. rarefaction threshold.ordination_plots: A list of lists containing the ordination plots for tested threshold values. If multiple repeat values were used, each one will be present in a different list.avg_distances: A data frame (or list of data frames if using multiple repeat values) with average pairwise distances of the cloud generated from each sample repetition attempts (for each threshold).
Details
Clustering performance is evaluated using the Calinski-Harabasz index. The function also calculates the average pairwise distance for each sample cloud across different rarefaction thresholds, to give a measure of sample concordance (how stable the sample is at different thresholds).
Higher index values are better, and the plateauing of the index values when
testing higher thresholds indicate that the clouds of repetitions are compact
enough to not being affected by increasing the threshold.
The Calinski-Harabasz value takes into account both within cluster and between
cluster distances, and in the scope of this function is calculated on the
group parameter.
A sudden drop in CH value means that samples might have been removed because
they did not have enough reads to reach the threshold. In this case a warning
is printed listing the samples which have been removed.
In avg_distances, if samples do not have enough reads to reach t_max value, their
APD are set to 0 after that threshold and a warning message is printed.