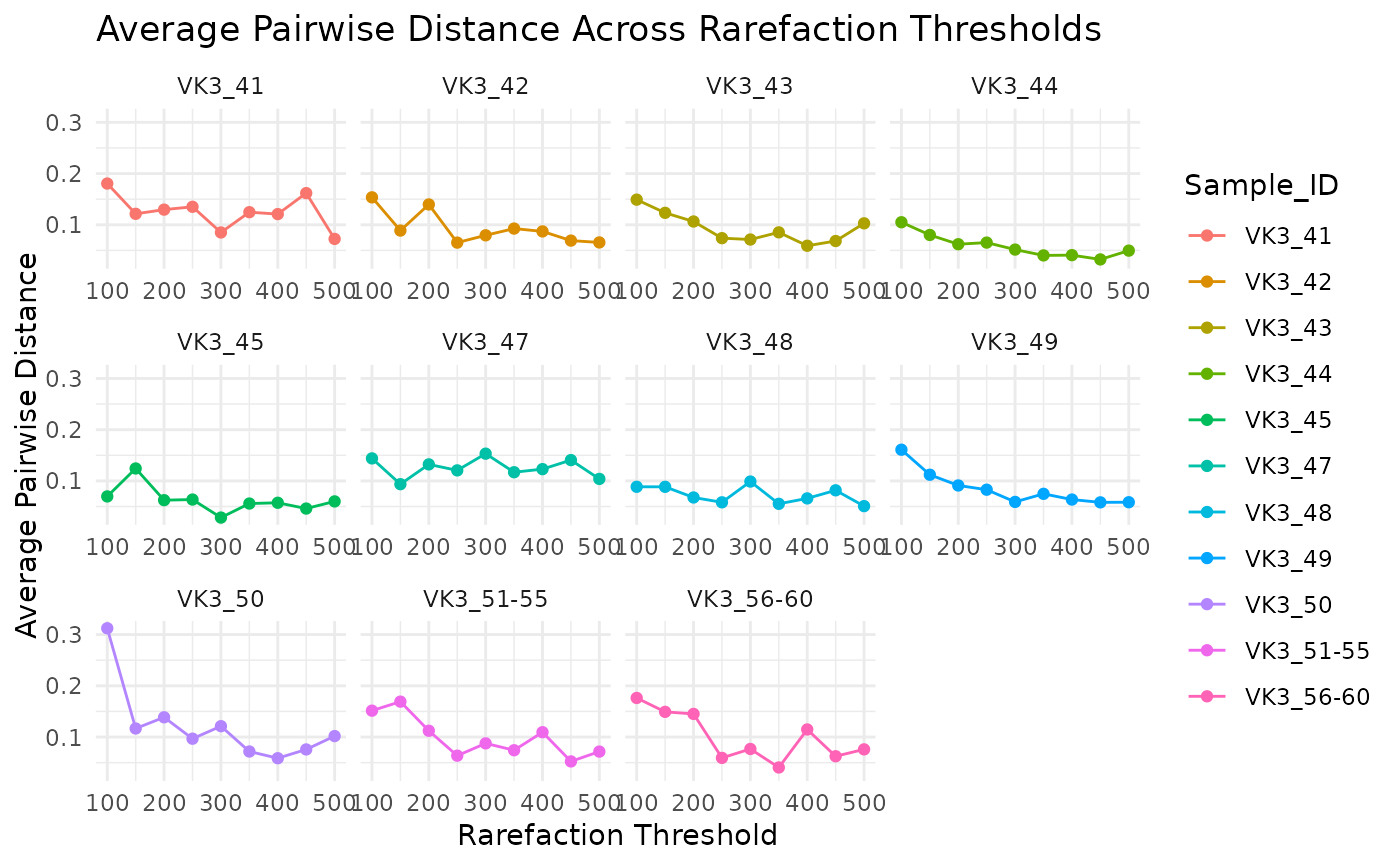
Plot average pairwise distance across thresholds
avg_pairwise_dist_plot.RdThis function it's a plotting function for avg_distances generated from
test_threshold.
Examples
library(Sibyl)
# Creating a smaller subset of the data
adults_sub <- phyloseq::subset_samples(adults, location=="VK3")
result <- test_threshold(adults_sub,
                         repeats = 10,
                         t_min = 100,
                         t_max = 500,
                         t_step = 50,
                         group = "location",
                         verbose = FALSE)
avg_pairwise_dist_plot(result$avg_distances$repeat_number_10)